City of Eau Claire, WI in Numbers
No matter which way you add, subtract, divide or multiply the numbers, Eau Claire's statistics always look good in comparison to other cities within the state and throughout the nation.
Eau Claire At-A-Glance
| Actual City Population (2019): | 70,157 |
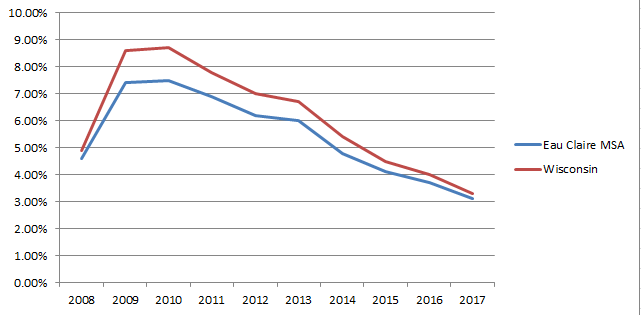
| Unemployment Rate (EC MSA 2019): | 3.1% |
| Per Capita Income (2019): | $27,725 |
| Median Family Income (2019): | $51,774 |
| Median Age: | 31.3 |
| Higher Education Institutions: | 3 |
| Major Hospitals: | 3 |
| Golf Courses: | 6 |
| Median Home Price (Owner Occupied, 2019): | $155,170 |
| Hotel Rooms: | 1,830 |
Sources: Esri Community Analytics Software, Community Profile Reprot, 2019 sourced form the U.S. Census Bureau